Extra Curriculum Support
This is a comprehensive educational resource designed to provide students with the tools and guidance necessary to excel. This support system is structured to cater to various aspects of learning, ensuring that students are well-prepared for academic challenges and practical applications of mathematical concepts. Some are the key benefits are mentioned below:
Comprehensive Learning: This holistic approach helps students gain a thorough understanding of the subject. Practical Application: The resources encourage students to apply mathematical concepts to real-life scenarios, enhancing their practical understanding and problem-solving skills.
Critical Thinking and Reasoning: Value-Based and HOTS questions promote critical thinking and reasoning abilities. These skills are crucial for students to tackle complex problems and make informed decisions.
Exam Preparedness: Sample Question Papers and NCERT Exemplar Solutions provide ample practice for exams. They help students familiarize themselves with the exam format and types of questions, reducing exam anxiety.
Ethical and Moral Development: Value-Based Questions integrate ethical and moral lessons into the learning process, helping in the overall development of students' character and social responsibility. By incorporating these diverse elements, Enhanced Curriculum Support aims to provide a robust and well-rounded knowledge, preparing students for both academic success and real-world challenges.
Sample Questions
SecA
- A graph that displays data that changes continuously over periods of time is:
(a) Histogram
(b) Line graph
(c) Pie chart
(d) Bar graph
- The given graph shows the progress of a cyclist during a ride. Which of the following describe the rider’s progress over the period of time:
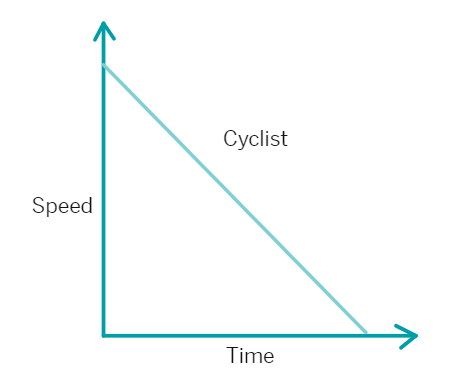
(a) Cyclist moves with uniform speed.
(c) As time passes the speed of cyclist decreases steadily.
(b) Speed of cyclist increases for a short time period and then increases very slowly.
(d) As time passes speed of cyclist increases
- The line graph shows the sale of dolls by Suhas from Monday to Saturday on a particular week. Given that cost of one doll is ₹ 35, how much did Suhas receive from the sale of dolls on Saturday?
(a) ₹ 200
(b) ₹ 700
(c) ₹ 1050
(d) ₹ 1400
SecC
At a birthday party, the children spin a wheel to get a gift.
Find the probability of:
(a) getting a ball
(b) getting a toy car
(c) getting any toy except a chocolate
SecE
- Read the following questions carefully:
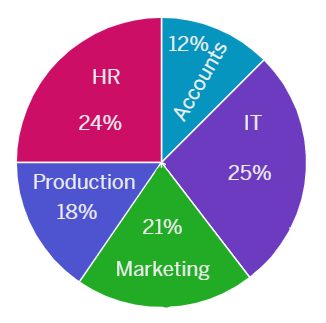
Number of employees in different departments of the organization = 3600
(i) What are the number of employees in the accounts department?
(a) 362
(b) 432
(c) 512
(d) 482
(ii) Ratio of the number of employees in the Production Department to the HR department is:
(a) 4:7
(b) 3:8
(c) 3:4
(d) 7:12
(iii) If 400 new employees are hired in the marketing department, then the ratio of the number of employees in the Marketing Department to the employees in the IT department is:
(a) 19:16
(b) 17:196
(c) 17:15
(d) 289:225
(iv) If 300 employees are shifted from the HR department to production department, then the ratio of the number of employees in the HR Department to the employees in the production department is:
(a) 91:37
(b) 97:29
(c) 38:17
(d) 28:59
(v) If 200 employees are hired in the accounts department and 100 employees of IT department left the organization, then the new ratio of the number of employees in the IT Department to the employees in the accounts department is:
(a) 79:100
(b) 81:100
(c) 85:97
(d) 77:97
- Answer the questions using the given graph:
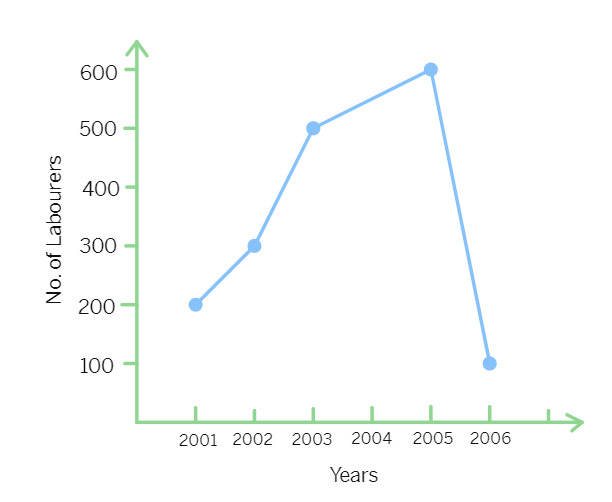
(i) In which year was the number of labourers maximum?
(a) 2002
(b) 2003
(c) 2001
(d) 2004
(ii) In Which year was the number of labourers minimum?
(a) 2004
(b) 2005
(c) 2003
(d) 2006
(iii) What was the difference of the number of labourers in the years 2002 and 2003?
(a) 400
(b) 200
(c) 100
(d) 300
(iv) Find the rise in the number of labourers from 2001 to 2004.
(a) 500
(b) 300
(c) 200
(d) 400
(v) Find the sum of the number of labourers in the years 2004 and 2006.
(a) 500
(b) 200
(c) 700
(d) 600
- Once Rohan was admitted in hospital due to heavy fever and body pain. Doctor did test for typhoid fever .The results revealed the positive for typhoid.
The doctor was not still sure about the illness .He advised the nurses to record the patient’s temperature hourly. The record of temp has been plotted as per above graph.
(i) What was the patient’s temperature at 1 p.m.?
(a) 36.5 °C
(b) 37 °C
(c) 38 °C
(d) 39 °C
(ii) What was the patient’s temperature at 10.30 am?
(a) 36.5 °C
(b) 39 °C
(c) 38 °C
(d) 37.5 °C
(iii) From which time temp raised very high?
(a) 10 am
(b) 11 am
(c) 9 am
(d) 12 pm
(iv) The highest temp was how many °C ?
(v) After 11 am temperature stated coming down.
(a) True
(b) False
Value Based Questions
Problem 1
- A health survey was conducted to find out how many servings of fruits and vegetables students consume daily. The data for a class of 25 students is as follows:
| Servings | No. of Students |
|---|---|
| 0 servings | 3 students |
| 1-2 servings | 10 students |
| 3-4 servings | 7 students |
| 5 or more servings | 5 students |
Represent this data using a pie chart. Discuss the importance of a balanced diet and how increasing the intake of fruits and vegetables can improve health.
Problem 2
- A class conducted a survey on how much water their families use daily. The data collected is as follows:
| Amount (Liters) | No. of Families |
|---|---|
| 50-100 liters | 4 families |
| 101-150 liters | 8 families |
| 151-200 liters | 10 families |
| More than 200 liters | 8 families |
Create a histogram to represent this data. Discuss the importance of water conservation and suggest ways families can reduce their water usage.
Problem 3
- A survey was conducted to find out how many books students read in a month. The data for a class of 28 students is as follows:
| No. of Books | No. of Students |
|---|---|
| 0 books | 6 students |
| 1-2 books | 10 students |
| 3-4 books | 8 students |
| 5 or more books | 4 students |
Represent this data using a bar graph. Discuss the importance of reading and how it can enhance knowledge and creativity.
HOTS
Q1
- Given the monthly rainfall data (in mm) for a city over the last year:
| Month | Rainfall (in mm) |
|---|---|
| January | 50 |
| February | 45 |
| March | 60 |
| April | 30 |
| May | 20 |
| June | 10 |
| July | 5 |
| August | 8 |
| September | 15 |
| October | 40 |
| November | 55 |
| December | 70 |
Predict the rainfall for the next three months using any suitable method of your choice (mean, median, or any trend analysis). Explain why you chose that particular method.
Q2
- A company claims that their new product increased sales by 150% over the last year. Given the data for last year's sales was 200 units, and this year's sales are 500 units, analyze the validity of their claim. Discuss the importance of accurate data representation and how misleading graphs or percentages can affect decision-making.
Q3
- Suppose you have the following data representing the scores of students in a mathematics test:
[56, 78, 45, 89, 95, 67, 82, 71, 90, 62]
If each student's score is increased by 10%, how will the mean and median change? Calculate and interpret the results.
NCERT Exemplar Solutions
Choose the correct option
Statements
- Which of the following is not a random experiment?
(a) Tossing a coin (b) Rolling a dice
(c) Choosing a card from a deck of 52 cards
(d) Thowing a stone from a roof of a building
- Observe the pie chart given below and answer questions based on it.
(i) Which colour received
(a) Red (b) Blue
(c) Green (d) Yellow
(ii) If 400 students voted in all, then how many did vote ‘Others’ colour as their favourite?
(a) 6 (b) 20
(c) 24 (d) 40
(iii) Which of the following is a reasonable conclusion for the given data?
(a)
(b) Green is the least popular colour
(c) The number of students who voted for red colour is two times the number of students who voted for yellow colour
(d) Number of students liking together yellow and green colour is approximately the same as those for red colour
- Data collected in a survey shows that 40% of the buyers are interested in buying a particular brand of toothpaste. The central angle of the sector of the pie chart representing this information is:
(a) 120° (b) 150°
(c) 144° (d) 40°
- Monthly salary of a person is Rs. 15000. The central angle of the sector representing his expenses on food and house rent on a pie chart is 60°. The amount he spends on food and house rent is:
(a) Rs. 5000 (b) Rs. 2500
(c) Rs. 6000 (d) Rs. 9000
- A dice is thrown two times and sum of the numbers appearing on the dice are noted. The number of possible outcomes is:
(a) 6 (b) 11
(c) 18 (d) 36
- The probability of getting a multiple of 2 when a dice is rolled is:
(a)
(c)
- Rohan and Shalu are playing with 5 cards, numbered: 4, 1, 2, 3 and 2. What is the probability of Rohan picking a card without seeing, that has the number 2 on it?
(a)
(c)
- The following pie chart represents the distribution of proteins in parts of a human body.
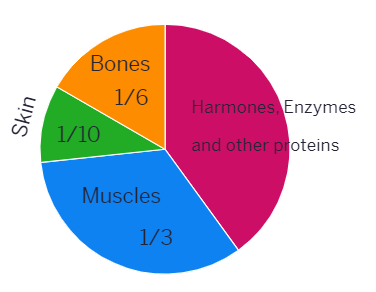
(i) What is the ratio of distribution of proteins in the muscles to that of proteins in the bones?
(a) 3 : 1 (b) 1 : 2
(c) 1 : 3 (d) 2 : 1
(ii) What is the central angle of the sector (in the above pie chart) representing skin and bones together?
(a) 36° (b) 60°
(c) 90° (d) 96°
(iii) What is the central angle of the sector (in the above pie chart) representing hormones enzymes and other proteins.
(a) 120° (b) 144°
(c) 156° (d) 176°
State if the following statements are True or False
Statements
The central angle of the sectors in a pie chart will be a fraction of 360°.
On throwing a dice, the probability of occurrence of an odd number is
1 2 A pie chart is also called a pictograph.
In a pie chart a whole circle is divided into sectors.
The central angle of a sector in a pie chart cannot be more than 180°.
Sum of all the central angles in a pie chart is 360°.
In a pie chart two central angles can be of 180°.
In a pie chart two or more central angles can be equal.
Getting a prime number on throwing a die is an event.
On throwing a dice once, the probability of occurence of a composite number is
1 2
Solve the below questions
Questions
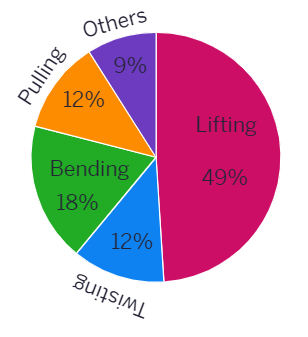
- Given below is a pie chart depicting the reason given by people who had injured their lower back.
Study the pie chart and find the number of people who injured their back while either bending and lifting. A total of 600 people were surveyed.
- The following data represents the different number of animals in a zoo. Prepare a pie chart for the given data.
| Animals | No. of animals |
|---|---|
| Deer | 42 |
| Elephant | 15 |
| Giraffe | 26 |
| Reptiles | 24 |
| Tiger | 13 |
- Given below is a pie chart showing the time spend by a group of 350 children in different games. Observe it and answer the questions that follow.
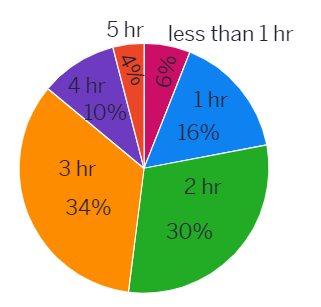
(a) How many children spend at least one hour in playing games?
(b) How many children spend more than 2 hours in playing games?
(c) How many children spend 3 or lesser hours in playing games?
(d) Which is greater — number of children who spend 2 hours or more per day or number of children who play for less than one hour?
- Look at the histogram below and answer the questions that follow:
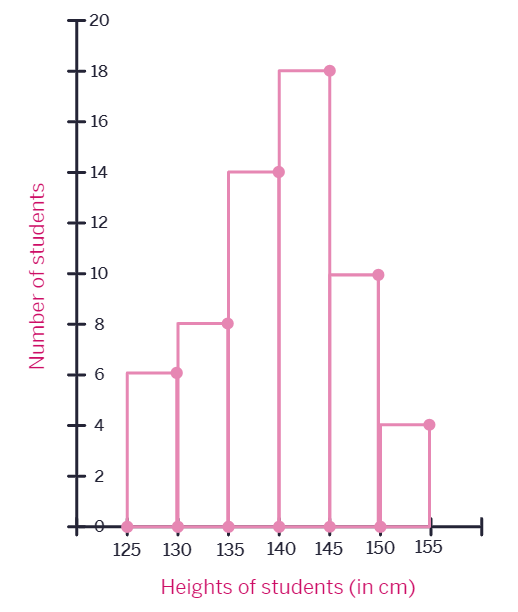
(a) How many students have height more than or equal to 135 cm but less than 150 cm?
(b) Which class interval has the least number of students?
(c) What is the class size?
(d) How many students have height less than 140 cm?
Case Based Questions
Q1
- The pie chart on the right shows the result of a survey carried out to find the modes of travel used by the children to go to school.Study the pie chart and answer the questions that follows:
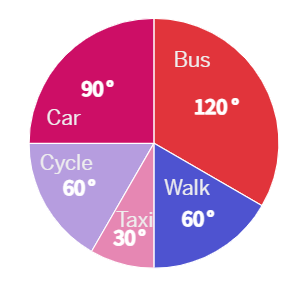
(i) What is the most common mode of transport?
(ii) How many children use taxi to travel to school?
(OR)
If 18 children travel by car, how many children took part in the survey?
(iii) What fraction of children travel by car?