Polygons
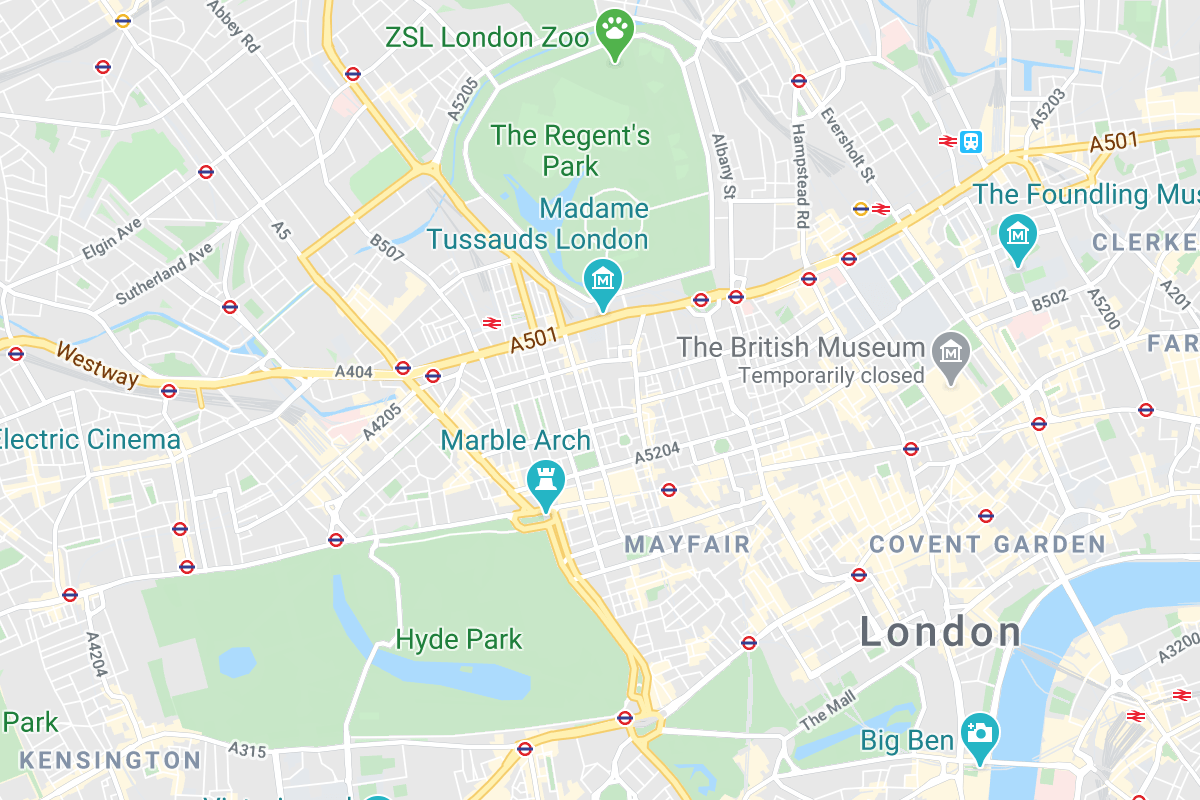
School districts need an accurate estimate of the number of students that may attend their schools. Below is a map of primary schools in London. In general, students attend the school closest to where they live. Click anywhere on the map to see the distance between that point and all the schools on the map.
Pick 4 other points on the map.
We’ve just made a Voronoi diagram. Each region contains all the points on the map that are closest to the school in that region. Click a few spots in different regions to check.
The first person to think about these things was probably
In our example, using a Voronoi diagram can help schools make estimates of how many students will attend. In London, about 1500 people live in each square kilometer. To use this statistic, we first need to first know the
Some of these regions are shapes we’ve learned about in previous chapters.
Click on the side of the triangle you want to use as the base.
Now draw in the height that corresponds with the base you selected.
The area of this triangle is [TODO]
[TODO] people live closest to that school and that can be a good starting point for the school to use to estimate how many students might attend that school. Next, the schools would want to use other statistics to estimate how many of those people are elementary aged students.
The other regions are more complicated. Some have
All of these regions in the Voronoi diagram are examples of polygons. A polygon is a closed, two-dimensional shape with straight sides that do not cross each other. A polygon does not have any holes in the shape. Click on a card below and drag it to the “Polygon” or “Non Polygon” side.
A regular polygon has
Let’s revisit the Voronoi diagram and find out how many people live in one of the regions with 5 sides. Note the
Just by looking at this region, it seems that
| The total area is equal to the area of the rectangle plus the area of | Total Area = Area of Rect + Area of Triangle 1 + Area of Triangle 2 |
| Area of a rectangle = b x h and Area of a triangle = | Total Area = |
| Click on the base and height of the rectangle | Total area = |
| Click on the base you want to use for triangle #1 and then draw in the corresponding height. | Total area = |
| Click on the base you want to use for triangle #2 and then draw in the corresponding height. | Total area = |
| Calculate the area of each shape | Total area = TODO |
| Calculate the total area | Total area = TODO |
[TODO]: People equation
So, indeed more students will likely attend the school in the pentagon region than the triangular region.
We give different names to polygons based on how many sides they have. You may remember some of the names. Drag the names on top of the correct shapes.
Polygons in real life
Let’s practice using these names by looking at some examples of polygons out in the world.
The Dome of the Rock is an Islamic Shrine in the Old City of Jerusalem. Built in 692 BCE, the base is a regular
The Giant’s Causeway in Northern Ireland is made up of over 40,000 polygonal basalt (a type of igneous rock) columns sticking out of the sea. The column outlined in white in
Most traffic signs are polygons - some regular and some irregular:
Regular triangle
Regular
Polygons show up in all sorts of natural objects - honeycomb and starfish - to name a few. The 10-sided starfish is a
The ground of a dried out desert, the skin patterns on giraffes, and dragonfly wings look strikingly similar to Voronoi diagrams!
Lastly, many flags use polygons. Drag the name of each country to the correct flag. Just make a guess if you’re not sure!
The hexagons in the South African flag and the pentagon in the Nepalese flag may not appear to be the standard image you may have in your head of a pentagon and a hexagon. Move around the vertices (these are the points where the edges meet) in the regular polygons below to make some irregular polygons of your own.
Tangram
Below are 7 polygons. Move and rotate the polygons to completely fill in the square
The set of these 7 polygons is called a tangram. The tangram is an ancient Chinese puzzle invented over 1,000 years ago during the Song Dynasty. In Chinese, the puzzle is called 七巧板. Pronounced “Chi-Chiao Pan,” this translates to “the seven intriguing pieces.” The goal of the puzzle is to use all 7 pieces to form any number of images. Below are just some of the shapes you can try to make at the Tangram activity on Mathigon!
Coming Soon!
In 1815, Shan Chiao published “New Figures of the Tangram” which contained 374 tangram puzzles!
Area of Polygons
Now that we have a firm understanding of polygons, let’s revisit thinking about the area of polygons. The football below is made up of 12 black
Most footballs are made of synthetic leather. Manufacturers make so many footballs that they pay great attention to the amount of synthetic leather they need to produce each football. Let’s find the amount of synthetic leather needed to make one professional football.
| A football is made up of | Total Area = 12 pentagons + 20 hexagons |
| Let’s split the pentagon into | Total Area = 12 x (Area of 5 triangles) + 20 x (Area of 6 triangles) |
| The area formula for a triangle is | Total area = |
| In the pentagon, click on the side you want to use as the base and then draw in the height. | Total area = |
| Calculate the area of one pentagon and one hexagon | Total area = 12 x |
| Calculate the area of the 12 pentagons and the 20 hexagons | Total area = |
| Calculate the total area | Total area = |
Recently, football manufacturers have begun to experiment with different shaped panels other than hexagons and pentagons. Here are some of the official footballs from the recent men’s World Cup tournaments.
2006 World Cup
2010 World Cup
2014 World Cup
2018 World Cup
While these designs are creative and interesting, some studies have shown that the different shaped panels impact how the ball travels through the air!
Below is a polygon from a different Voronoi diagram. Each grid represents 1 square kilometer. Let’s find the area of this region in a few different ways.
Coming Soon!
No matter which approach we take, the area of the pentagon is 27.5 square units!
Curry’s Paradox
Throughout our work on area, we have often used the idea that as parts of a shape are moved around, the area stays the same - as long as the pieces don’t overlap and all the pieces are used.
We’ve made a triangle with a base of 13 units and a height of 5 units. The area of this triangle is
This triangle also has a base of
This situation is called Curry’s Paradox. A paradox is a statement or situation that contradicts itself. This paradox, created by American mathematician
Let’s take the shape apart and find the area of each piece to help us see what’s happening here.
The red triangle has a base of 8 and a height of 3, so the area of the red triangle is
Well, it turns out that neither of the shapes we made using the 4 pieces are in fact triangles. Below is the 1st arrangement. It looks like the red and blue triangles line up perfectly, but they do not. Move the slider below to zoom in on the green line connecting the corners of two triangles.
While the blue and red seem to line up so the ends connect with a straight line, they do not. Using the formula ½ x b x h to find the area of this
In the 2nd arrangement, the shapes also seem to make a triangle with the same total area, but we’ve used one additional square unit. So, our first thought was that the area of these 4 shapes decreased by one. Move the slider below to zoom in on the green line connecting the corners of two triangles.
Adding the extra square unit into this arrangement of the 4 pieces causes the triangles to bulge outside of the green line. So, this arrangement is not a triangle either! The total area of the pieces is remaining constant at 32!
So, we’ve made sense of this paradox. The area of the green triangle is 32.5 square units and the area of the 4 pieces is 32 square units. The pieces do NOT fit perfectly inside the triangle. When we tried just using the 4 pieces, we still had
In the second arrangement, we added in an additional square unit to make the 4 pieces fit inside the green triangle. Again, it seemed to fit, but it actually was
Phew! Our fundamental idea that the area of shapes remains the same regardless of the arrangement of the shapes remains true. We’ll use this idea to explore circles in the next few chapters.