Enhanced Curriculum Support
This is a comprehensive educational resource designed to provide students with the tools and guidance necessary to excel. This support system is structured to cater to various aspects of learning, ensuring that students are well-prepared for academic challenges and practical applications of mathematical concepts. Some are the key benefits are mentioned below:
1.Comprehensive Learning: This holistic approach helps students gain a thorough understanding of the subject. Practical Application: The resources encourage students to apply mathematical concepts to real-life scenarios, enhancing their practical understanding and problem-solving skills.
2.Critical Thinking and Reasoning: Value-Based and HOTS questions promote critical thinking and reasoning abilities. These skills are crucial for students to tackle complex problems and make informed decisions.
3.Exam Preparedness: Sample Question Papers and NCERT Exemplar Solutions provide ample practice for exams. They help students familiarize themselves with the exam format and types of questions, reducing exam anxiety.
4.Ethical and Moral Development: Value-Based Questions integrate ethical and moral lessons into the learning process, helping in the overall development of students' character and social responsibility. By incorporating these diverse elements, Enhanced Curriculum Support aims to provide a robust and well-rounded knowledge, preparing students for both academic success and real-world challenges.
Sec A
(1) Consider the relation between the area and the side of a square given by A =
(a) Draw a graph to show this relation.
(b) From the graph, find the value of A when x = 4.
(c) Is this graph a linear graph?
(2) Draw a graph for the following.
| Side of square (in cm) | Perimeter (in cm) |
|---|---|
| 2 | 8 |
| 3 | 12 |
| 3.5 | 14 |
| 5 | 20 |
| 6 | 24 |
(i) Write the scale along the X axis and Y axis?
(ii) What is marked on the horizontal axis?
(iii) What is marked on the vertical axis?
(iv) What is marked on the points plotted?
(v) Is it a line graph?
(3) The graph given below shows the marks obtained out of 10 by Sonia in two different tests. Study the graph and answer the questions that follow.
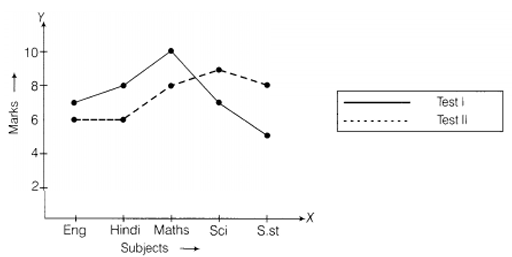
(a) What information is represented by the axes?
(b) In which subject did she score the highest in Test I?
(c) In which subject did she score the least in Test II?
(d) In which subject did she score the same marks in both the Tests?
(e) What are the marks scored by her in English in Test II?
(f) In which test was the performance better?
(g) In which subject and which test did she score full marks?
(4) Ajit can ride a scooter constantly at a speed of 30 kms/hour.
Draw a time-distance graph for this situation. Use it to find:
(i) the time taken by Ajit to ride 75 km.
(ii) the distance covered by Ajit in 3
Problem 1
A city council monitors pollution levels over a week and represents the data on a graph. The pollution level on Day 1 was 45 units, and it steadily increased by 5 units per day.
Plot the pollution levels on a graph for the week.
Based on the graph, suggest two measures the city council can take to reduce pollution.
Problem 2
A farmer sells the following quantities of wheat in kilograms over five months:
| Month | Quantity (kg) |
|---|---|
| January | 200 |
| February | 250 |
| March | 300 |
| April | 400 |
| May | 450 |
Draw a graph to represent the data.
How does the graph help the farmer plan future sales?
Discuss the importance of farmers in our society.
Q1
A family tracks their monthly grocery expenses using a line graph. The graph shows an upward trend with a steep rise in the last two months.
How can the family use this information to adjust their spending habits?
If the trend continues, what would be their grocery expense in the next month?
Q2
Two graphs represent the earnings of two shopkeepers over the same time period. The first graph is a straight line, while the second graph is a curve that increases steeply toward the end.
What does the difference in the shapes of the graphs tell you about the two shopkeepers’ businesses?
How can this analysis help shopkeepers plan their strategies for future growth?
Q3
A line graph represents the water level in a tank over time. The water level starts at 50 liters, rises to 100 liters in 10 minutes, and then decreases to 30 liters over the next 15 minutes.
When was the tank being filled, and when was it being emptied?
If the tank was emptied at a constant rate, calculate the rate of water outflow per minute.
How could such graphs help in managing water resources?
Choose the correct option
Questions
(1) Comparison of parts of a whole may be done by a:
(a) bar graph (b) pie chart (c) linear graph (d) line graph
(2) A graph that displays data that changes continuously over periods of time is:
(a) bar graph (b) pie chart (c) histogram (d) line graph
(3) The point (3, 4) is at a distance of:
(a) 3 from both the axis
(b) 4 from both the axis
(c) 4 from the x axis and 3 from y axis
(d) 3 from x axis and from y axis
Fill in the blanks
Questions
(1) ? displays data that changes continuously over periods of time.
The relation between dependent and independent variables is shown through a ?.
We need ? coordinates for representing a point on the graph sheet.
A point in which the x-coordinate is zero and y-coordinate is nonzero will lie on the ?.
The horizontal and vertical line in a line graph are usually called ? and ?.
The process of fixing a point with the help of the coordinates is known as ? of the point.
The distance of any point from the y-axis is the ? coordinate.
All points with y-coordinate as zero lie on the ?.
For the point (5, 2), the distance from the x -axis is ? units.
A double bar graph is useful for the ? of two sets of data.
Data represented in a circular form is called a ? chart.
The graph of a linear equation is always a ? line.
The cartesian system used two axes which are ? to each other.
State whether the statements are true (T) or false (F).
Questions
(1) A line graph can also be a whole unbroken line.
(2) The ordinate of a point is its distance from the y-axis.
(3) The y-coordinate of any point lying on the x -axis will be zero.
(4) Points (3, 4) and (4, 3) represent the same point on the graph.
Answer the following questions
Questions
(1) The cost of a note book is Rs 10. Draw a graph after making a table showing cost of 2, 3, 4, .... note books. Use it to find:
(a) the cost of 7 notebooks.
(b) The number of note books that can be purchased with Rs 50.
(2) Draw a graph for the radius and circumference of circle using a suitable scale.
(Hint : Take radius = 7, 14, 21 units and so on)
From the graph,
(a) Find the circumference of the circle when radius is 42 units.
(b) At what radius will the circumference of the circle be 220 units?
(3) The following table gives the growth chart of a child.
| Height (in cm) | Age (in years) |
|---|---|
| 2 | 75 |
| 4 | 90 |
| 6 | 110 |
| 8 | 120 |
| 10 | 130 |
Draw a line graph for the table and answer the questions that follow.
(a) What is the height at the age of 5 years?
(b) How much taller was the child at the age of 10 than at the age of 6?
(c) Between which two consecutive periods did the child grow more faster?
(4) The graph given below compares the price (in Rs) and weight of 6 bags (in kg) of sugar of different brands A, B, C, D, E, F.
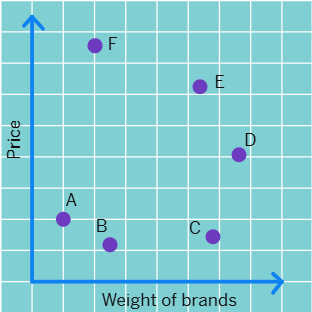
(a) Which brand(s) costs/cost more than Brand D?
(b) Bag of which brand of sugar is the heaviest?
(c) Which brands weigh the same?
(d) Which brands are heavier than brand B?
(e) Which bag is the lightest?
(f) Which bags are of the same price?
Q1
The process of a seed developing into a new plant is called germination and this process depends on water, air, temperature and sunlight supplied to it. Dhruva did an experiment to understand the germination process by first soaking chickpea, green gram, and paddy seeds in water overnight and then providing the required environment for their growth. He noted the growth (length) of the shoot and root in these three types of seeds, in centimetres, on days 1, 4, 7 and 10, as given in the below table.
| S.No. | Part | Seed | Day 1 | Day 4 | Day 7 | Day 10 |
|---|---|---|---|---|---|---|
| 1 | Shoot | Chickpea seed | 0 | 0.7 | 1.6 | 3.4 |
| 2 | Shoot | Green gram seed | 0 | 0.5 | 0.9 | 1.2 |
| 3 | Shoot | Paddy seed | 0 | 0 | 0 | 0.1 |
| 4 | Root | Chickpea seed | 0.4 | 3.1 | 7.3 | 9.4 |
| 5 | Root | Green gram seed | 0.2 | 3.4 | 4.8 | 5.6 |
| 6 | Root | Paddy seed | 0 | 0 | 0.4 | 0.9 |
Plant Life Germination - Sample filled observation table
Using the information from the table, he plotted the root and shoot growth for a chickpea seed in the first 10 days, as shown below.
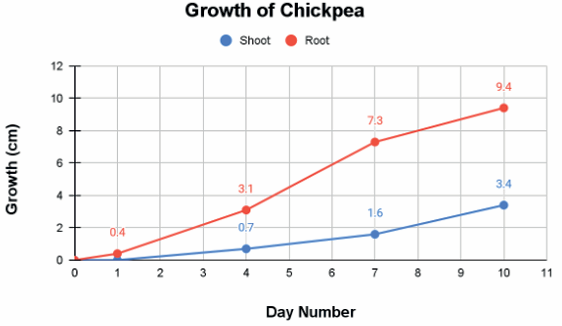
Root and shoot growth for a chickpea seed in the first 10 days
He also plotted the graph of root growth in different seeds for the first 10 days, as shown below.
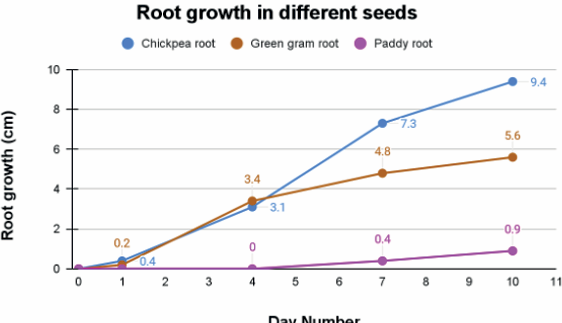
Root growth in different seeds in the first 10 days
Refer to these graphs and answer the questions below.
(1) Which of the statements below is a wrong interpretation of the graph for the chickpea seed ? Analyse the first graph to find the growth of the roots and shoots in the first 10 days.
(a) The root grows faster than the shoot.
(b) Shoot growth is slower in the first 4 days when compared with the next 3 days.
(c) Root growth is fastest in the first 4 days.
(d) The difference between the root to shoot length is maximum on the 10th day.
(2) (i) On a Wednesday morning, Dhruva’s mother, a primary school teacher, remembered that next Monday she was to teach about seed germination. She decided to show root and shoot growth to her class as a demonstration. Which seed do you suggest she soak in water and leave for germination so that she can show it to her class, based on Dhruva’s observations? (Refer the second graph)
(a) Paddy
(b) Chickpea or green gram
(c) Paddy or chickpea
(d) Green gram or paddy
(ii) Which of the conclusions below cannot be arrived at by looking at the second graph shown above?
(a) The growth of the chickpea seed surpasses the growth of the green gram seed within five days
(b) Root growth of around 4 cm is first seen in the green gram seed
(c) Paddy seeds take a longer time to germinate when compared to chickpea and green gram seeds
(d) Each seed takes its own time to germinate and its own time to grow longer roots
(3) In the graphs shown in both the above graphs, the number of days is plotted along the x-axis, and growth is considered along the y-axis because ?.
(a) The number of days is a dependent variable that depends on the seed type.
(b) Growth length is an independent variable that depends only on the seed type and not on the number of days.
(c) The number of days is an independent variable as it is not decided based on the growth length, whereas the growth changes with the day number.
(d) Growth length is an independent variable, since the root and shoot length is not the same for a given day for a particular seed.
Sol
(1) Option (d)
(2) (i) Option (b) (ii) Option (d)
(3) Option (c)
Q2
In order to calculate the taxi fare, usually a taxi meter system is used. During the journey, as long as the taxi meter is active, you will be charged based on 3 main criteria: an initial fee, a per km (or mile) fee, and a wait time fee.
Initial fee – This is a flat fee charged at the beginning of every ride.
Cost per km – This is the fee charged for each km of your journey.
Cost per minute (wait time fee) – This is the fee charged if the driver is kept waiting for more than a stipulated time.
So the Total Fare = Base Fare + (Cost per km × ride distance) + (Cost per minute × wait time).
If you are planning to travel longer distances, you often cannot go ahead with hiring a cab by just looking at the base fares charged by the company. Using a linear graph, you are able to calculate the possible amount of the bill for a certain number of kilometres. Linear graphs help to predict the values of the dependent variable.
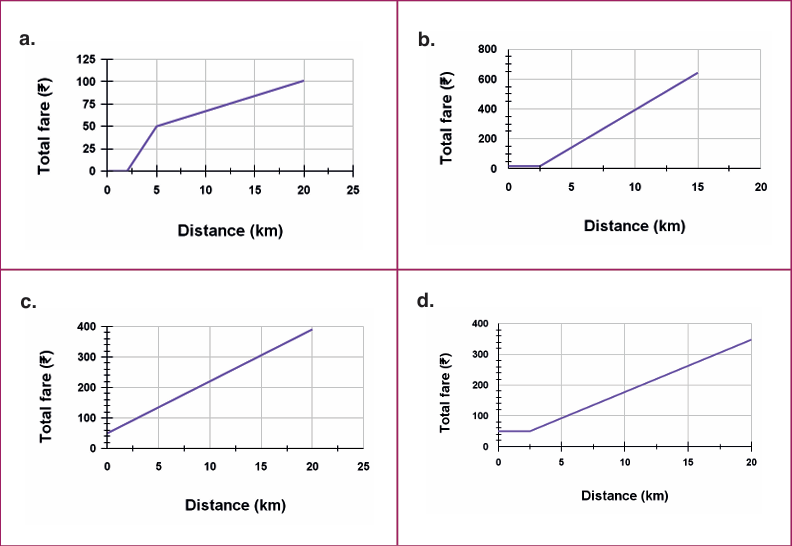
(1) Star Taxi is a famous service provider that operates in a tourist city. It has a flat fare of ₹50 for the first 2.5 kilometres and for the subsequent distance it is ₹17 per kilometre. Taking the distance covered as x km and the total fare as ₹ y, a graph is plotted. Which of the given graphs captures the taxi fare details correctly? (Ignore the waiting time fare).
Sol
(1) Option (a)
Q3
Recently, one more taxi service - Book Car - started its service in the same city where Star Taxi is running. Competition in such matters is great for consumers. To retain customers, Star Taxi revised its prices. Both taxis' base fare and cost per kilometre are displayed in advertisement hoardings and this data is also accessible to all while booking a cab. Using these data, graphs shown below are plotted.
Book Car and Star Taxi
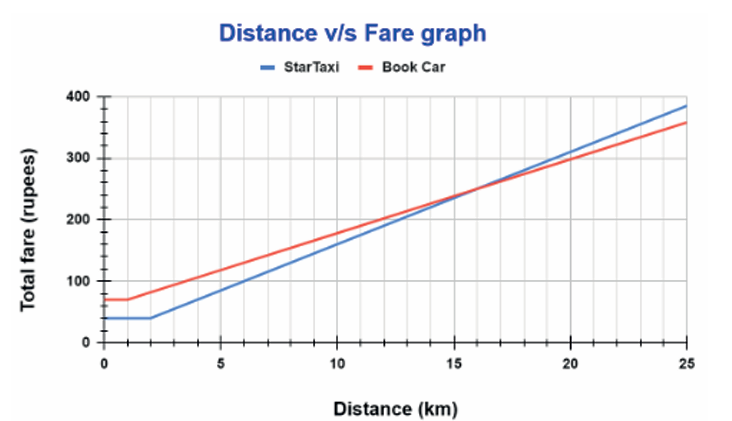
Distance v/s Fare graph for Book Car and Star Taxi
(1) By looking at the distance v/s total fare graphs for the two taxi services, answer the questions below.
(i) What does the y co-ordinate for x = 0 (i.e., y-intercept) of the graph tell you about?
(a) Book Car taxis have a smaller base fare than Star Taxi
(b) Book Car taxis have a higher base fare than Star Taxi
(c) The cost per kilometre of a Book Car taxi is higher than that of Star Taxi
(d) The total cost for a journey is always cheaper in Star Taxi
(ii) Under what conditions is it more economical to use Book Car and why?
Sol
(1) (i) Option (b)
(ii) Book Car becomes more economical when the savings from its lower cost per kilometer outweigh the difference in base fares. This occurs at a longer distance where the two lines intersect.
From the graph: At distances beyond the intersection (~12 km), Book Car is more economical because its overall fare grows more slowly due to a lower cost per km.
Book Car has a higher base fare but a lower cost per kilometer than Star Taxi, making it more suitable for long-distance rides.
Q4
Book Car taxi operators own a few petrol-operated taxis and a few diesel taxis. Petrol and diesel prices fluctuate based on crude oil prices. The graph below shows the maximum price of petrol and diesel per litre during different months in the same city.
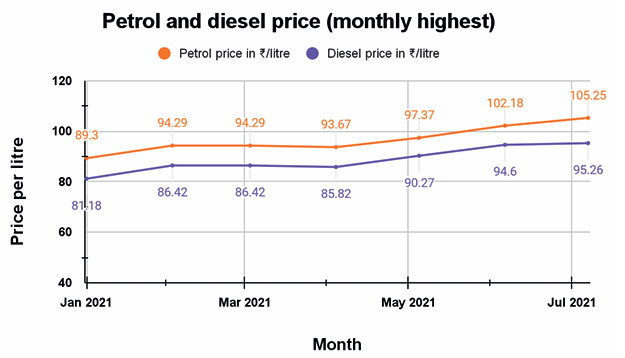
Graph showing petrol and diesel price variation across the months
(1) (i) By which of the steps specified below can one arrive at the answer to the question - In which month is the difference between refuelling with 25 litres of fuel for one petrol operated car and one diesel operated car the least?
(a) Look for the least price of petrol from the graph and the corresponding month is the answer
(b) Look for the least price of diesel from the graph and the corresponding month is the answer
(c) Check the difference between the price of petrol and diesel during each month and pick the month corresponding to the least difference
(d) Find the lowest price of petrol and the lowest price of diesel; the month corresponding to the lowest of these values is the answer
(ii) The graph above tells us how the price of one litre of petrol/diesel changes during the year. If we want to see how the total cost of petrol/diesel varies on a given day, as we increase the quantity of fuel purchased, what would the graph(s) look like? We will plot the quantity of the fuel on the x-axis (5 litres, 10 litres, 15 litres, 20 litres and 25 litres) and the corresponding cost along the y-axis.
(a) Two line graphs, with a line for petrol cost always above the line for diesel cost
(b) Two linear graphs, with the line representing petrol cost always above the line representing diesel cost
(c) Two intersecting line graphs
(d) Two parallel lines, with the line representing petrol cost always above the line representing diesel cost
(2) To revise the existing cost per kilometre charges, the taxi association analysed the time taken to cover a particular distance in major areas of the city. One such random distance-time graph for a journey is shown below.
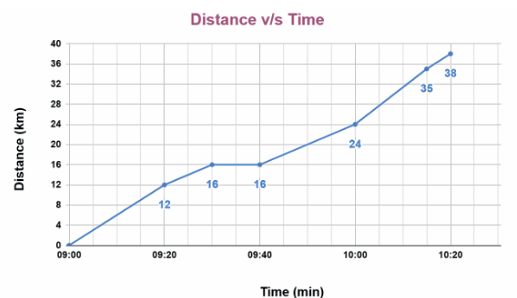
Distance v/s time graph
(i) How far was the destination of this journey from its starting point?
(ii) What was the total time taken for this journey?
(iii) This journey path included a traffic blockage due to the Prime Minister’s visit to a nearby stadium inauguration. Can you identify the duration for which this journey was affected by the traffic block? Also, specify the distance at which this traffic block happened by looking at the graph.
(iv) In which duration was the journey the fastest?
Sol
(1) (i) Option (c) (ii) Option (b)
(2) (i) 38 km
(ii) 1 hour and 20 minutes
(iii) In the graph, we can observe a flat portion between 09:40 and 10:00. This flat portion indicates that the distance covered remained constant during this time, suggesting a traffic blockage.
Therefore, the traffic block lasted for 20 minutes (from 09:40 to 10:00), and it occurred at a distance of 16 km.
(iv) The fastest journey corresponds to the steepest slope on the graph. Analyzing the graph, we can see that the steepest slope is between 09:00 and 09:20.
Q5
Printed with a grid, graph paper serves as a great guide for everything from architectural drawings to maths equations. In fact, graph paper has long been appreciated by artists, architects and scientists for its ability to explain their visions. There are a number of ways to develop accurate line drawings. Tracing from a reference photo and drawing freehand are two common ways to create a line drawing. For beginners, the lines and intersections of the grid in the graph provide reference points for placing the features and other details of the drawing.
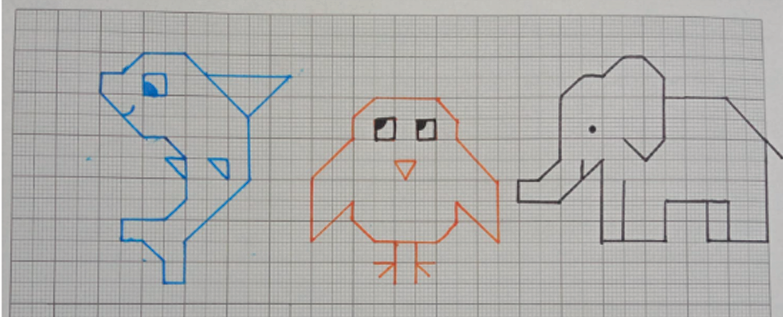
Simple drawings using a graph
One such symmetrical drawing of a tulip flower that has identical parts mirroring each other across the y-axis is shown below. Note that it has only one leaf completed and another is to be drawn.
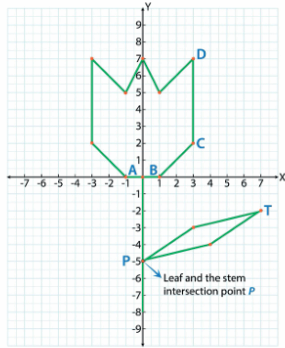
Tulip drawing using a graph
(1) (i) Write the co-ordinates of the four vertices that form the leaf shape in the given drawing. (Check tulip graph drawing)
(ii) The tulip image above is to be completed by drawing one more leaf to the left of the y-axis, which is symmetrical to the existing leaf. Which of the point/s below cannot be a part of this new leaf? (There can be more than one correct option).
(a) (-3, -3)
(b) (0, -5)
(c) (-7, -2)
(d) (-5, 0)
(e) (4, -4)
(2) Pick the correct reason for the given assertion statement about the leaf and the stem intersection point P by choosing the appropriate option. (Refer to tulip diagram). Select all that are applicable.
Assertion (A): Point P lies on the y-axis.
Reason (R): ?.
(a) To reach point P, we have to stay along the y-axis but move away from the x-axis
(b) To reach point P, we have to stay along the x-axis but move away from the y-axis
(c) This is because to reach point P we have to move an equal distance along both axes
(d) Point P has co-ordinates (0, -5) and this indicates that it lies on the y-axis
(3) Sudha randomly marks 4 points in the empty space of the graph sheet after completing this tulip drawing. Three out of the four points marked by her are such that they all have the y - co-ordinate as -5 and the fourth point is point P itself (intersection of the stem and the leaf). By joining these four points, she will obtain ?. (Select all that are applicable)
(a) A straight line parallel to AB
(b) A straight line parallel to BC
(c) A straight line parallel to CD
(d) A straight line passing through P
(4) Sumati was also trying to draw the tulip on her graph paper. She was finding it difficult to mark the tip of the leaf, point T (refer to tulip diagram). Which of the information given below will help her locate T exactly?
(I) Point T is 7 units from the origin
(II) Point T is 2 units down from the x-axis
(III) Point T is 4 units to the right of point C
Choose the correct option.
(a) I and II
(b) Only II
(c) II and III
(d) All the three bits of information are necessary
Sol
(1) (i) A: (-1, 1), B: (1, 1), C: (4, 2), D: (3, 7)
(ii) Option (b) and (e)
(2) Option (a)
(3) Option (a) and (d)
(4) Option (a)