Venn Diagrams
Venn Diagrams, also known as Venn-Euler diagrams, are a visual tool used to illustrate the relationships between different sets.
They use shapes, typically circles, to represent sets, and the placement and overlap of these circles show the relationships between the sets.
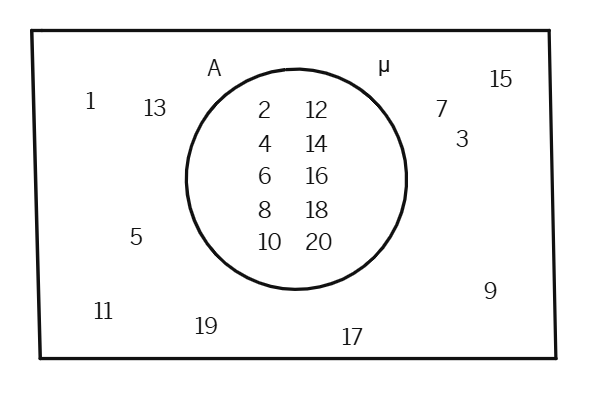
1. Consider that μ = {1,2,3...,20} is the universal set for which, A = {2,4,6,8,10,12,14...,20} is a
Then the Venn Diagram is as:
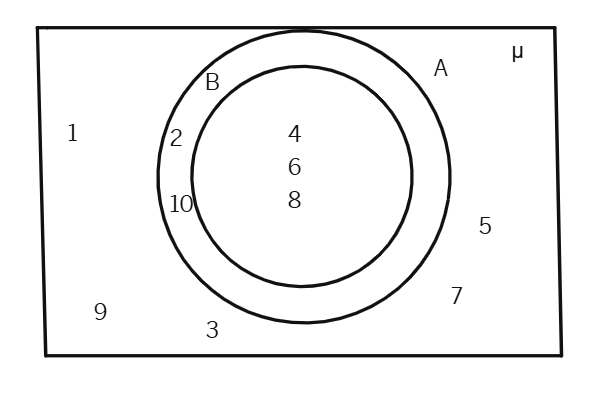
2. μ = {1,2,3...,10} is the universal set of which , A = {2,4,6,8,10} and B = {4,6,8} are subsets and also B
Then, the Venn-diagram is :
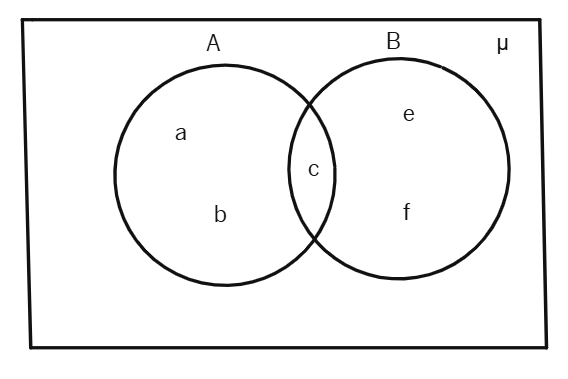
3. Let A = {a,b,c,d} and B = {c,d,e,f}
Then we illustrate these sets with a Venn diagram as :